Ethereum remains in a bearish zone and it traded below $2,350 against the US Dollar. ETH price could accelerate lower if there is a close below $2,300.
- Ethereum extended its decline below the $2,400 and $2,350 levels.
- The price is now trading well below $2,400 and the 100 hourly simple moving average.
- There is a crucial bearish trend line forming with resistance near $2,380 on the hourly chart of ETH/USD (data feed via Kraken).
- The pair could extend its decline if the bulls fail to protect the key $2,300 support zone.
Ethereum Price Remains At Risk
Ethereum started a steady decline from well above $2,500, similar to bitcoin. ETH traded below the $2,450 and $2,400 support levels to move into a bearish zone.
There was also a break below the $2,350 support zone and yesterday’s low. The price is now trading well below $2,400 and the 100 hourly simple moving average. Ether is managing to stay above the key $2,300 support zone. A low is formed near $2,304 and the price is consolidating losses.
An initial resistance is near the $2,350 level. The first key resistance is near the $2,380 level. There is also a crucial bearish trend line forming with resistance near $2,380 on the hourly chart of ETH/USD.
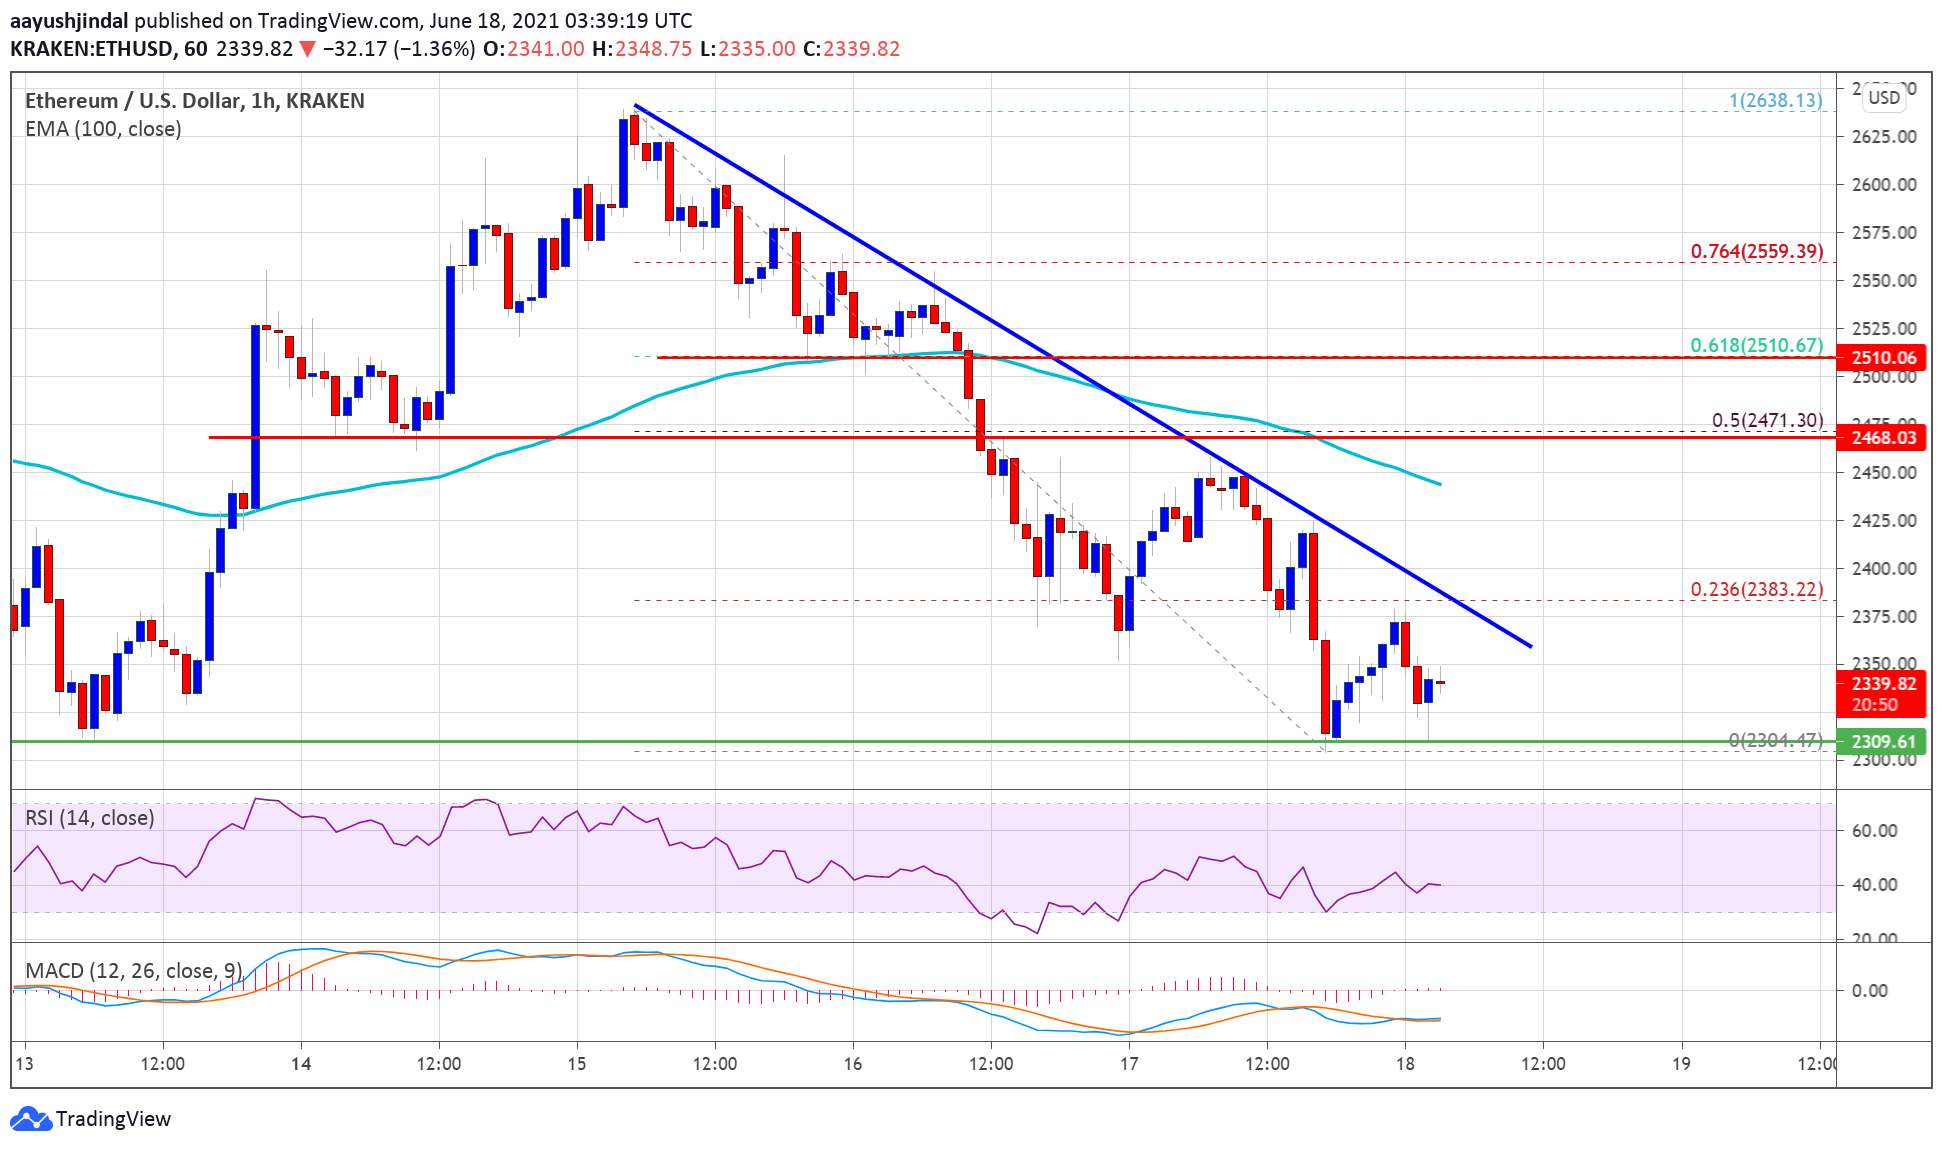
Source: ETHUSD on TradingView.com
The trend line is near the 23.6% Fib retracement level of the of the recent drop from the $2,640 swing high to $2,304 low. The first major resistance is near the $2,400 level. The main resistance is now forming near the $2,450 level and the 100 hourly simple moving average. It is close to the 50% Fib retracement level of the of the recent drop from the $2,640 swing high to $2,304 low.
More Losses in ETH?
If Ethereum fails to clear the $2,380 and $2,400 resistance levels, it could continue to move down. An initial support on the downside is near the $2,320 level.
The main breakdown support is now forming near the $2,300 level. A downside break below the recent low and the $2,300 support level may possibly spark a major decline. In the stated case, ether price is likely to decline towards $2,150 in the near term.
Technical Indicators
Hourly MACD &- The MACD for ETH/USD is struggling to gain pace in the bullish zone.
Hourly RSI &- The RSI for ETH/USD is currently near the 40 level.
Major Support Level &- $2,300
Major Resistance Level &- $2,400

You can get bonuses upto $100 FREE BONUS when you:
💰 Install these recommended apps:
💲 SocialGood - 100% Crypto Back on Everyday Shopping
💲 xPortal - The DeFi For The Next Billion
💲 CryptoTab Browser - Lightweight, fast, and ready to mine!
💰 Register on these recommended exchanges:
🟡 Binance🟡 Bitfinex🟡 Bitmart🟡 Bittrex🟡 Bitget
🟡 CoinEx🟡 Crypto.com🟡 Gate.io🟡 Huobi🟡 Kucoin.


Comments