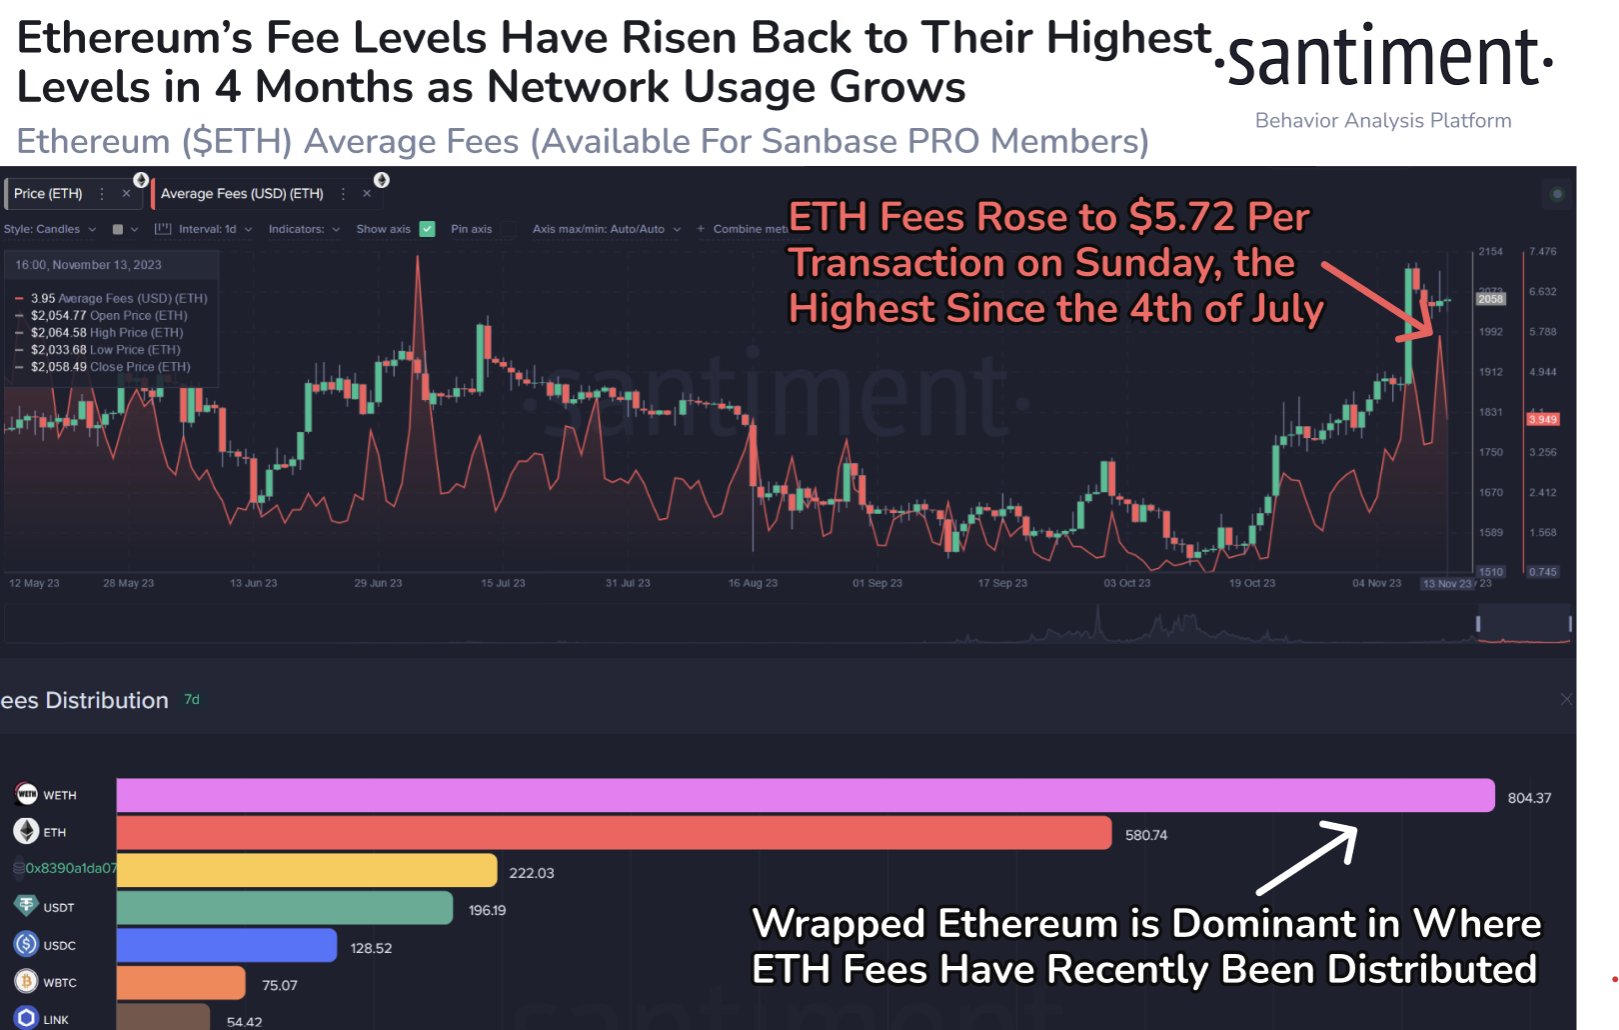
On-chain data shows the average transaction fees on the Ethereum network have hit a 4-month high as user activity has spiked.
Ethereum Average Fees Recently Hit The $5.72 Mark
According to data from the on-chain analytics firm Santiment, the transaction fees on the ETH network have shot up as the cryptocurrency has recently broken above the $2,000 level.
The relevant metric here is the “average fees,” which keeps track of the mean amount of fees that the users on the Ethereum blockchain are attaching with their transfers right now.
Generally, the value of this metric rises whenever the user activity on the network goes up. The reason behind this is that the ETH network only has a limited capacity to handle transactions.
If a user wants to get their transfer through as soon as possible during a period of rush, they have no choice but to attach a fee that’s higher than the average so that the validators have some incentive to process their move first.
When the traffic is especially high, the average fees can quickly spiral out of control as users compete against each other. On the other hand, when there is little activity on the network, senders have no reason to go for a high fee, so the mean on the blockchain naturally remains low.
Now, here is a chart that shows the trend in the Ethereum average fees over the past few months:
As displayed in the above graph, the Ethereum average fees have gone up recently as the cryptocurrency’s price has observed a rally. Historically, the fees going up during such a period of volatility hasn’t been that unexpected, as the investors find sharp price action exciting, so they tend to make more moves.
Instead, it’s more worrying if a rally doesn’t accompany a spike in network usage, as it means that the holders aren’t paying attention to the cryptocurrency. Without a high trader interest, surges can easily run out of fuel, thus dying off before long.
This weekend, the Ethereum average fees hit a value of about $5.72, the highest level that the indicator has touched since the 4th of July, more than four months ago. However, these levels are still not much compared to the $14 values in May.
Below the chart, Santiment has also attached the data for the distribution of the fees across the various tokens on the blockchain. Wrapped ETH (WETH) appears to have shown the most dominant activity in the past week.
As for what these high fees could mean for the asset, the current high usage naturally implies that the investors are actively participating in the market. However, the outcome of this doesn’t necessarily have to be bullish.
This high activity, if it keeps up, could result in more price volatility as many investors make moves at once, but its direction can go either way.
ETH Price
As the chart shows, Ethereum has continued to move flat above the $2,000 mark in the past few days.

You can get bonuses upto $100 FREE BONUS when you:
💰 Install these recommended apps:
💲 SocialGood - 100% Crypto Back on Everyday Shopping
💲 xPortal - The DeFi For The Next Billion
💲 CryptoTab Browser - Lightweight, fast, and ready to mine!
💰 Register on these recommended exchanges:
🟡 Binance🟡 Bitfinex🟡 Bitmart🟡 Bittrex🟡 Bitget
🟡 CoinEx🟡 Crypto.com🟡 Gate.io🟡 Huobi🟡 Kucoin.


Comments