Cardano showed an uptrend after it was trading laterally, the coin has now settled above the $0.47 support mark. Over the past week, the coin gained 7.2% but over the last 24 hours ADA lost 1% of its market value. After the consolidation, the coin targeted its immediate resistance mark.
If the coin continues to remain at the current price level then bulls can be back in the market for a longer time period. The buyers also seem to be back in the market which has pushed ADA to show signs of relief.
If buying strength loses its vigour then, the coin can move to $0.45, post which the coin can trade as low as $0.40.
Even now the coin seems to be trading within a tight range, but the push above the $0.49 mark has displayed itself as a sign of bullishness. With consistent buying strength, Cardano can move past the $0.50 price mark.
Cardano Price Analysis: Four Hour Chart
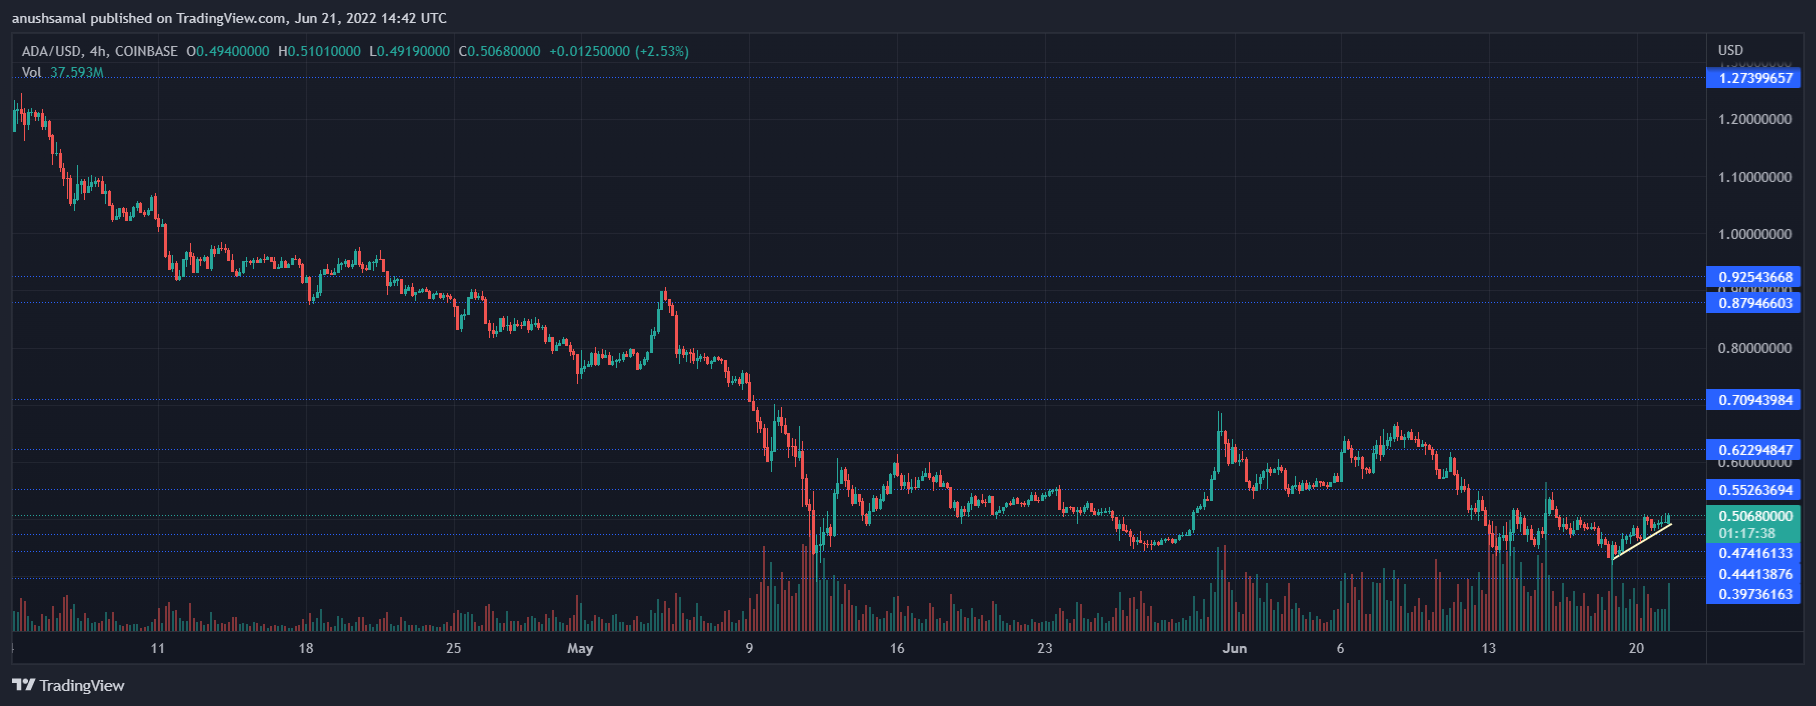
ADA was trading at $0.51 on the four hour chart after it broke past its consolidation phase. The closest support level of the altcoin stood at $0.47 but slight push from sellers can drag prices to $0.40. There was bullish signals on the four hour chart.
An ascending trendline points at bullishness (yellow). Push from buyers can help Cardano to rise to $0.52 and then to $0.56. To invalidate bearish thesis completely the coin has trade above the $0.56 for substantially long.
The volume of Cardano traded also shot up indicating that buyers were active in the market. The volume bar was green signifying bullish price action.
Technical Analysis
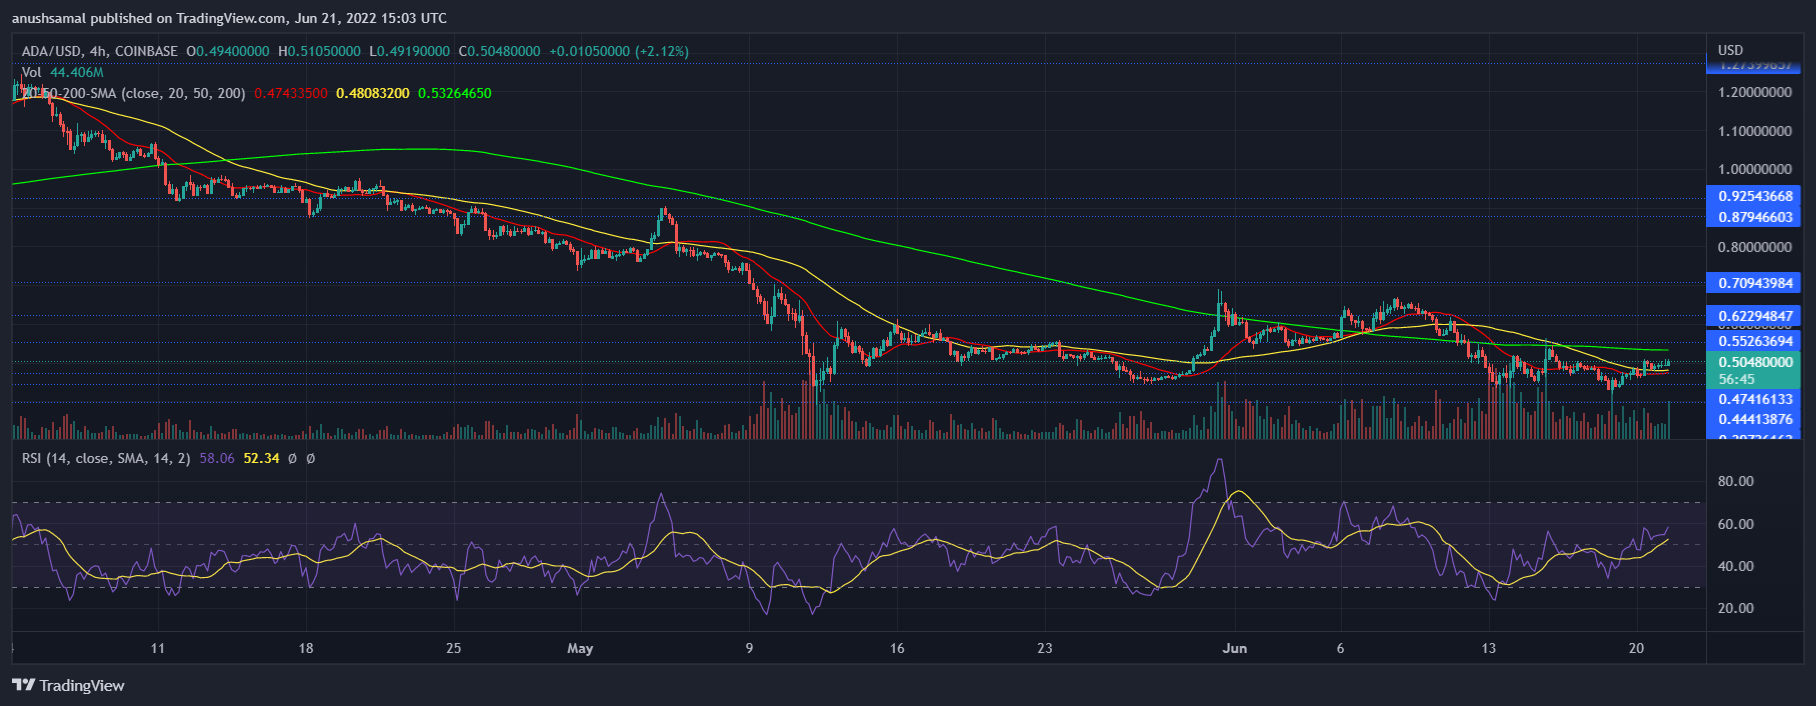
Buying strength painted consistent upward movement over the past few days. The Relative Strength Index painted the same picture, the indicator was well above the half-line. This reading is tied to bullishness as buyers have taken over the market.
Other technical also indicated buyers taking over. The price of ADA was above the 20-SMA line. A reading above which signifies that buyers were in control of the price momentum as they were responsible for driving it forward.
Related Reading | Cardano Resists Downward Pressure, Can ADA’s Price Push Bears Away?
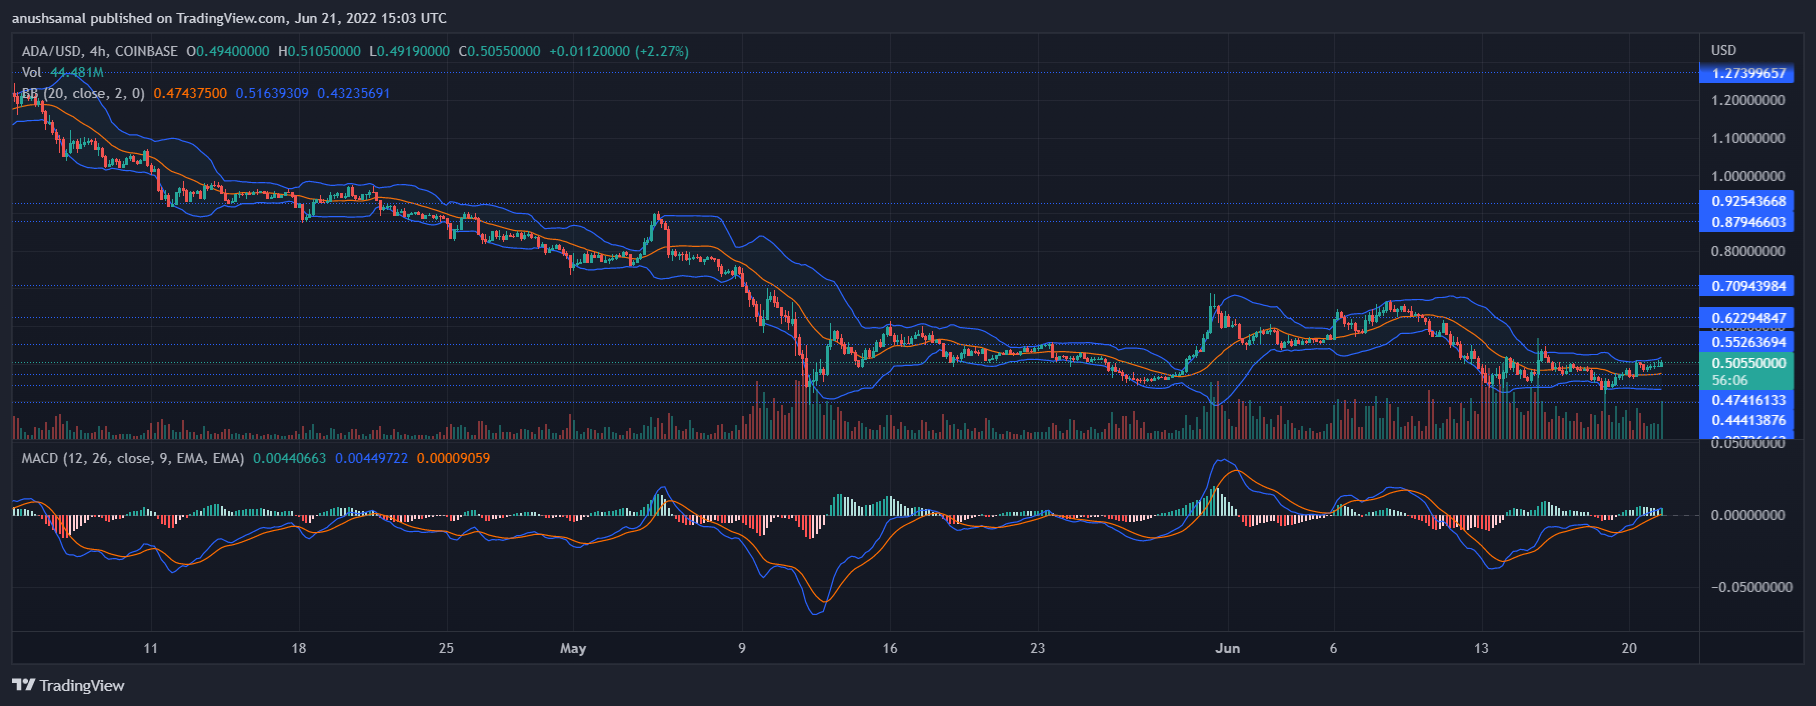
ADA’s buying momentum showed positiveness on the four hour chart. Moving Average Convergence Divergence depicts price momentum and a trend reversal too. MACD underwent a bullish crossover and flashed green signal bars.
These green bars are buy signals for the coin, this meant that bullishness was present in the market. Other indicators too have shown strength in buyers.
Bollinger Bands indicate price volatility and they were parallel on the chart. Parallel Bollinger Bands means that price of the asset will hover around the same price range and that further indicates continued relief for the coin.
Related Reading | Will The Vasil Hard Fork Trigger A Cardano (ADA) Bull Run?
Featured image from UnSplash, chart from TradingView.com
Tags: ADACardanoprice analysis

You can get bonuses upto $100 FREE BONUS when you:
💰 Install these recommended apps:
💲 SocialGood - 100% Crypto Back on Everyday Shopping
💲 xPortal - The DeFi For The Next Billion
💲 CryptoTab Browser - Lightweight, fast, and ready to mine!
💰 Register on these recommended exchanges:
🟡 Binance🟡 Bitfinex🟡 Bitmart🟡 Bittrex🟡 Bitget
🟡 CoinEx🟡 Crypto.com🟡 Gate.io🟡 Huobi🟡 Kucoin.












Comments