Bitcoin's recent price movements have caused concern among investors about what might come next. However, by looking at key indicators such as the 200-week moving average, Pi Cycle Top Indicator, and the Golden Ratio Multiplier, we can gain insights into potential support and resistance levels for Bitcoin.
Leaning Bearish?
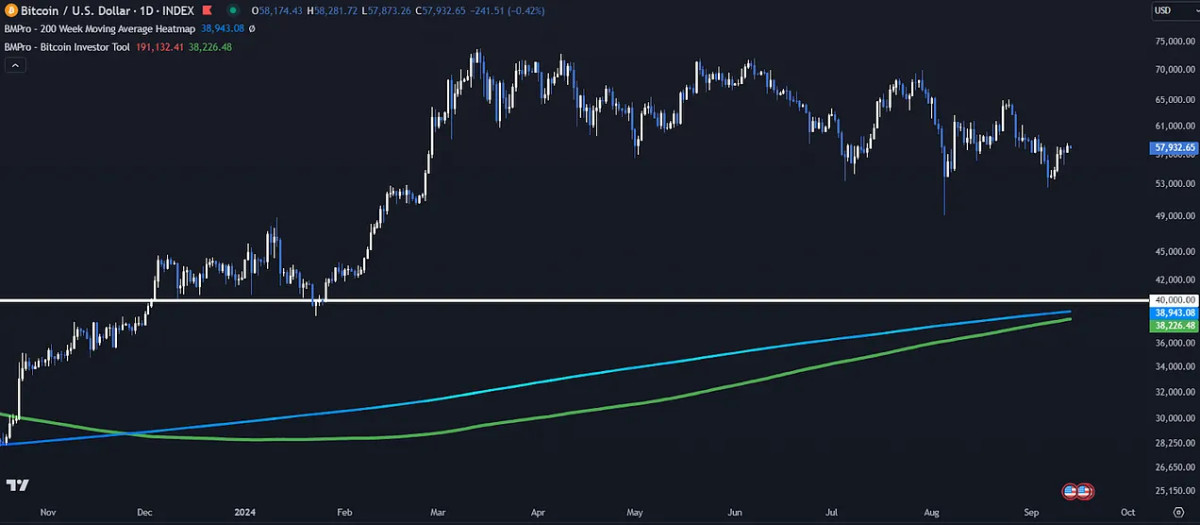
In recent weeks, Bitcoin's price has fluctuated, dipping as low as $53,000 before stabilizing in the middle of our newly formed $50,000 to $60,000 range. If this bearish price action is to continue and price breaks to lower lows the 200-week moving average heatmap (blue line), a historically critical support level, is currently close to $39,000 but fast approaching $40,000 (white line). This round psychological level also aligns with the Bitcoin Investor Tool (green line), which has also converged with the 200-week moving average, could serve as potential downside targets.

Nearby Targets
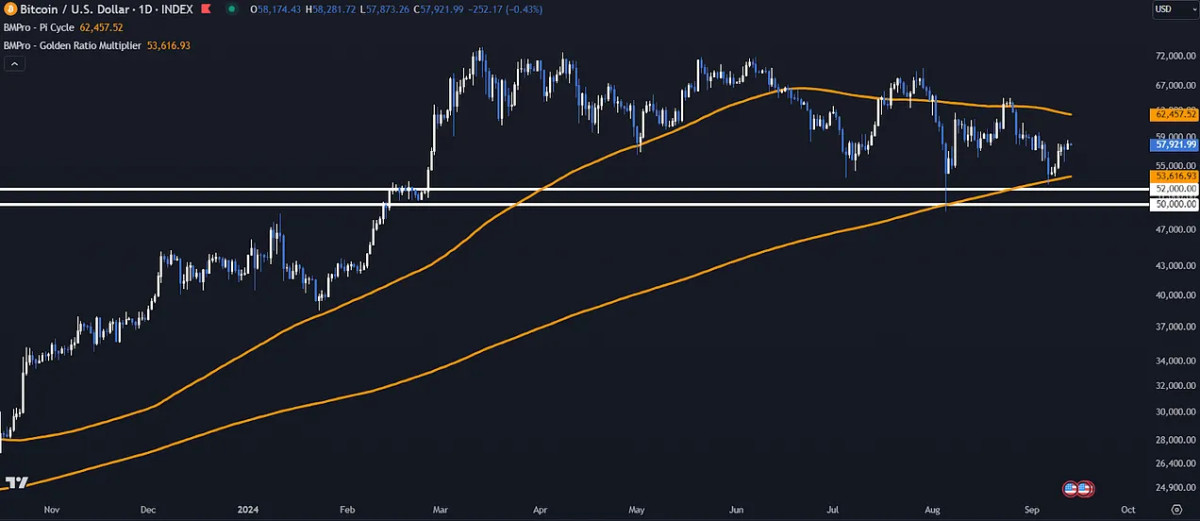
Above current price there are several important levels closer to the current price that investors need to keep an eye on. The Pi Cycle Top Indicator (upper orange line) suggests a crucial resistance level around $62,000, based on the 111-day moving average. The Golden Ratio Multiplier (lower orange line) indicates that the 350-day moving average, currently around $53,000, has been a solid level of support during this market cycle, especially as this is close to the technical $52,000 support and significant psychological support of $50,000.

More Chop?
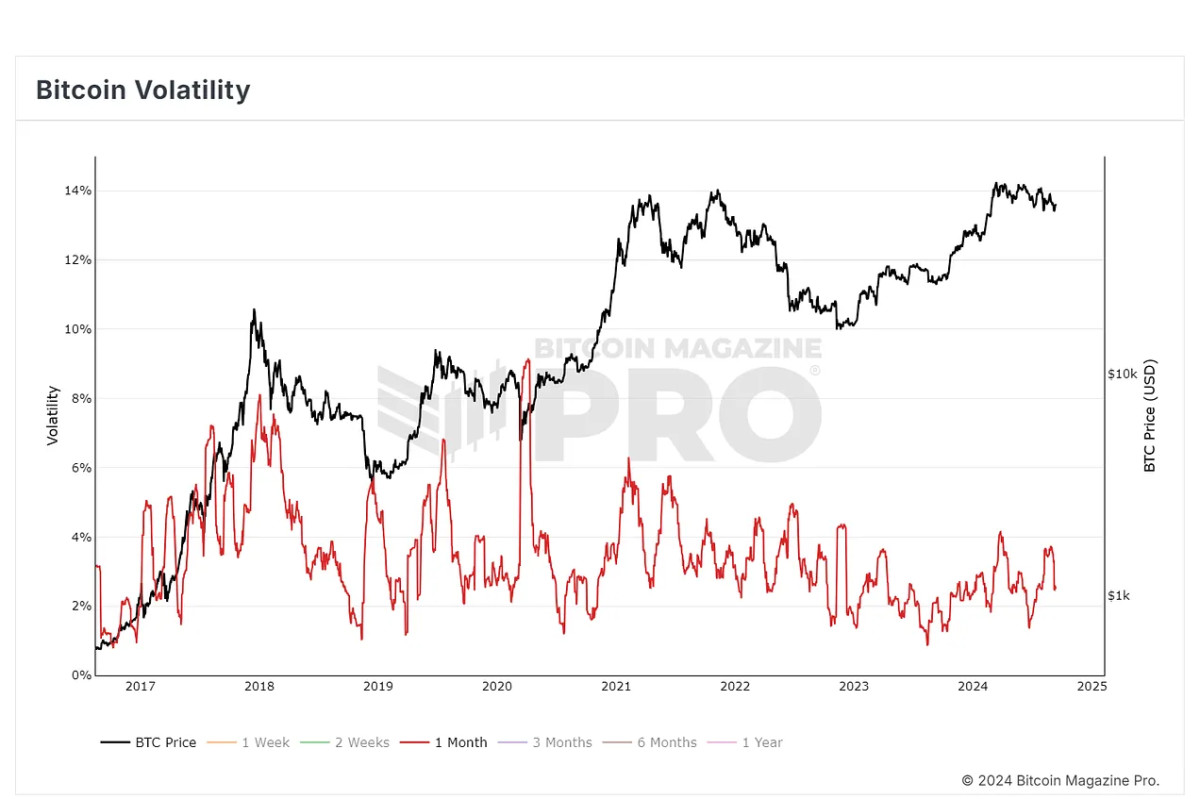
In the short term, Bitcoin could very well continue ranging between the low $50,000 region and the $60,000 resistance, similar to the range we had formed between $70,000 and $60,000 that led to fairly stagnant price action for a majority of 2024. Despite recent downturns, Bitcoin's long-term outlook is still promising. In the past, Bitcoin has experienced similar periods of fluctuating prices before eventually reaching new highs. However, this process can take some time, potentially weeks or even months, before a sustainable trend reversal occurs following periods of low volatility.

Conclusion
For long-term investors, it's important to remain calm and not be swayed by day-to-day price changes. Over-trading often leads to poor decisions and losses, and the key is to stick to a strategy, whether it involves accumulating at support levels or taking profits at resistance.
Bitcoin's recent price action has not been ideal, but with some simple technical analysis and a clear understanding of support and resistance levels, investors can prepare and react rather than over overreact to natural market fluctuations.
For a more in-depth look into this topic, check out our recent YouTube video here: Bitcoin Price Action: What to Expect Next

You can get bonuses upto $100 FREE BONUS when you:
💰 Install these recommended apps:
💲 SocialGood - 100% Crypto Back on Everyday Shopping
💲 xPortal - The DeFi For The Next Billion
💲 CryptoTab Browser - Lightweight, fast, and ready to mine!
💰 Register on these recommended exchanges:
🟡 Binance🟡 Bitfinex🟡 Bitmart🟡 Bittrex🟡 Bitget
🟡 CoinEx🟡 Crypto.com🟡 Gate.io🟡 Huobi🟡 Kucoin.


Comments