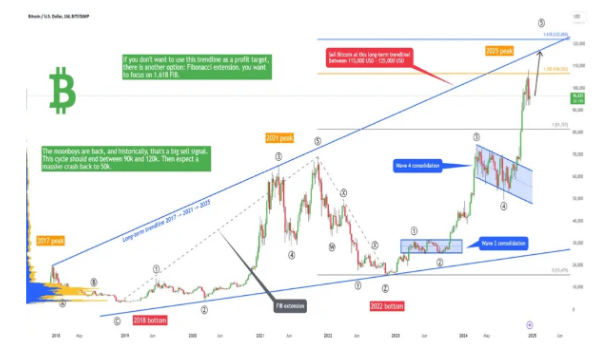
A push to $40,000-$42,000 won't protect Bitcoin from risks of undergoing a major price decline later, suggests a century-old price prediction model created by technical analyst titan Richard Wyckoff.
Overconfident Bitcoin (BTC) bulls would need to battle more than just Elon Musk as a price prediction model — created by technical analyst pioneer Richard Wyckoff more than 100 years ago — also goes against their wild upside predictions.
Dubbed as Wyckoff Method, the model involves a five-phase approach to determine price trends that majorly involve investors' psychological reaction to an asset's supply and demand.
For example, in the case of accumulation, when an asset tends to bottom out following sharp price moves downhill, the five phases in order include Selling Climax (SC), Successful Secondary Test (ST), Last Point of Support (LPS), Sign of Strength (SOS), and "stepping stones" — that signifies more demand for the asset.

On the other hand, the Distribution case appears like a 180-degree version of the Accumulation case, consisting of five phases that follow a strong price trend upward.

The Preliminary Supply (PSY) signals a strong demand shift upward as price trends higher while accompanying increasing volumes. However, the uptrend ultimately exhausts, leading to an even called buying climax (BC). It follows a sell-off caused by a lack of demand near the asset's price stop against abundant supply. Wyckoff called the correction as Automatic Reaction (AR).
Together, PSY, BC, and AR make Phase A.
Meanwhile, Phase B involves a fake rebound towards BC, called Secondary Test (SET), followed by another drop that shows the asset's Sign of Weakness (SOW). Phase B also typically sees weak rebound attempts from SOW towards Upthrust (UT). Later, the transition to Phase C witnesses a terminal shakeout in distribution, known as Upthrust After Distribution (UTAD).
Phase D involves an alarming lapse of demand against supply, also known as the Last Point of Supply (LPSY), leading to an all-and-all price crash in Phase E.
Bitcoin in 'Phase C'
Tempting Beef, an independent market analyst, alerted his followers that Bitcoin has entered the Accumulation cycle of the classic Wyckoff model. The pseudonymous entity flashed recent rebounds in the Bitcoin market, apprehensibly pointing at BTC/USD's potential to sustain a bullish trend above $40,000 on weakening supply and rising demand.
"Supply is getting exhausted. [It] could be ready for phase C."
But Tempting Beef presented a conflicting scenario by reimagining Phase A per Wyckoff Distribution schematics. The analyst marked the Bitcoin rebound from $30,000-low as a sign of PSY, leading up to BC, AR, ST, SOW, and other successive events mentioned across the Distribution phases.

Bitcoin again landed itself in Phase C, which alarmed about demand exhaustion in the case of Wyckoff Distribution Events. It would mean that the cryptocurrency's point of least risk is to the downside — a price crash.
Technicals skewed to downside
Bitcoin's latest correction in the spot market surfaced following a yearlong rally. Between March 2020 and April 2021, the BTC/USD exchange rate ballooned by as much as 1,582%, logging an all-time high near $65,000.
However, the pair wiped more than 50% of its price rally. The prices crashed, recovered, and they now consolidate sideways without hinting at a specific short-term bias for direction. Therefore, it now appears more like a Wyckoff Distribution model, since the phases follow a yearlong move upward, not downward.
Meanwhile, Bitcoin has been consolidating inside a symmetrical triangle structure following its sharp downside correction after mid-May, hinting that the pattern is — in fact — a bearish pennant. Technically, bearish pennants send the prices lower by as much as the scale of the previous move lower.

BTC/USD is trading at around $36,000, or 44.59% below its $65,000-top as of this time of writing.

You can get bonuses upto $100 FREE BONUS when you:
💰 Install these recommended apps:
💲 SocialGood - 100% Crypto Back on Everyday Shopping
💲 xPortal - The DeFi For The Next Billion
💲 CryptoTab Browser - Lightweight, fast, and ready to mine!
💰 Register on these recommended exchanges:
🟡 Binance🟡 Bitfinex🟡 Bitmart🟡 Bittrex🟡 Bitget
🟡 CoinEx🟡 Crypto.com🟡 Gate.io🟡 Huobi🟡 Kucoin.


Comments